This is a deep-dive exploration from: Strategic Innovation: Escaping the Gravity of the Present
Strategic Innovation Risk Management: A CTO's Comprehensive Guide to Risk Registers and Mitigation Strategies
Executive Summary
Strategic innovation demands more than creative ambition; it requires a disciplined risk architecture that protects the core while enabling exploration. This deep dive provides Chief Technology Officers with an exhaustive, implementation-ready framework for managing risk across McKinsey's Three Horizons. It covers horizon-aware risk registers, scoring methodologies, SQL and JSON data models, Python scoring utilities, mitigation strategy design, a 90-day implementation playbook, and case studies from Nokia, Kodak, Amazon, and Microsoft.
1. Problem Statement: Why Strategic Innovation Risk Management Is a CTO Imperative
Strategic innovation is the disciplined practice of managing the present while inventing the future. Yet every horizon—Horizon 1 core optimization, Horizon 2 adjacent growth, and Horizon 3 disruptive invention—carries a distinct risk signature. For a Chief Technology Officer, the challenge is not merely to identify these risks in isolation, but to build an integrated risk architecture that prevents the core business from choking exploration while protecting the enterprise from existential threats hidden inside speculative bets.
The failure modes are well documented. Nokia’s collapse from global handset dominance was not a technology deficit; it was a Horizon 3 governance failure in which emerging smartphone platforms were repeatedly downgraded because they threatened the cash-generating core. Kodak invented the digital camera but structured its risk appetite around film margins, allowing Horizon 2 and Horizon 3 assets to starve. Amazon Web Services succeeded because Amazon separated the nascent cloud business from retail metrics long enough for it to mature. In each case, the decisive variable was not the quality of the idea, but the rigor with which risks were registered, scored, governed, and mitigated.
Traditional enterprise risk management often treats innovation as a single line item labeled "strategic risk." That is insufficient. A CTO needs a horizon-aware risk register that maps each initiative to its time horizon, quantifies uncertainty, assigns accountable owners, and links mitigation strategies to measurable residual risk targets. This deep dive provides that framework.
2. Theoretical Foundations: Risk, Uncertainty, and the Three Horizons
2.1 The Three Horizons as a Risk Topology
McKinsey’s Three Horizons model, introduced by Baghai, Coley, and White in The Alchemy of Growth, frames growth as a portfolio of activities with different risk-return profiles. Horizon 1 optimizes the core, Horizon 2 builds emerging businesses, and Horizon 3 creates options for the future. Each horizon demands different metrics, governance, and therefore different risk management treatment.
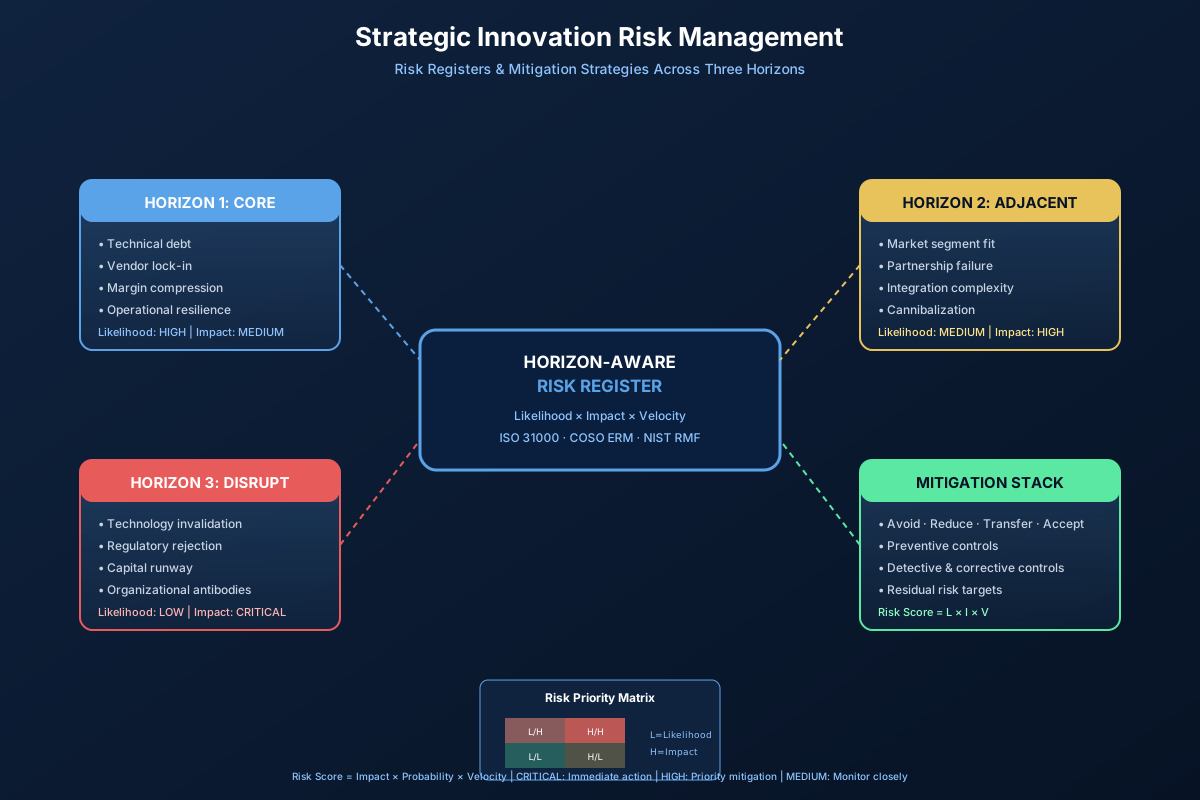
Horizon 1 risks are typically high-likelihood, lower-severity events: technical debt accumulation, margin compression, key-person dependency, vendor concentration, and incremental security exposure. Horizon 2 risks shift toward market and execution uncertainty: customer segment mismatch, partnership failure, integration complexity, brand dilution, and cannibalization of the core. Horizon 3 risks are low-likelihood individually but potentially existential collectively: technology invalidation, regulatory rejection, capital runway exhaustion, competitor leapfrogging, and false-positive market signals.
The topology matters because a single enterprise-wide risk appetite statement will misallocate controls. Applying Horizon 1 operational discipline to Horizon 3 experiments kills learning velocity; applying Horizon 3 venture tolerance to Horizon 1 operational systems invites reliability disasters.
2.2 ISO 31000 and the Risk Management Process
ISO 31000:2018 defines risk as the effect of uncertainty on objectives. The standard prescribes a cyclical process: communication and consultation, scope and context establishment, risk assessment (identification, analysis, evaluation), risk treatment, monitoring and review, and recording and reporting. The framework in this deep dive aligns each step to a CTO operating model.
Risk identification must be both top-down (executive scenario planning) and bottom-up (engineering retrospectives, support tickets, post-mortems). Risk analysis converts qualitative judgments into semi-quantitative scores. Risk evaluation compares scores against risk appetite. Risk treatment selects controls and owners. Monitoring closes the loop with leading and lagging indicators.
2.3 COSO ERM and Strategy-Performance Integration
COSO’s 2017 Enterprise Risk Management framework argues that risk management should be integrated with strategy and performance, not bolted on as a compliance exercise. For technology leaders, this means risk registers should directly inform product roadmap prioritization, capital allocation, and engineering capacity planning. Every major initiative should have an explicit risk-adjusted value proposition.
2.4 Knowns and Unknowns: The Rumsfeld Matrix
Donald Rumsfeld’s famous taxonomy—known knowns, known unknowns, and unknown unknowns—remains a practical diagnostic. Known knowns belong in the risk register with standard mitigation. Known unknowns require sensing mechanisms: market experiments, technical spikes, and competitive intelligence. Unknown unknowns demand resilience: modularity, optionality, insurance, and rapid reconfiguration capacity. A mature innovation risk program designs controls for all three quadrants.
3. Risk Register Architecture: The Single Source of Truth
3.1 The Anatomy of a Horizon-Aware Risk Register
A risk register for strategic innovation must contain more than a list of worries. It needs structured fields that enable sorting, filtering, aggregation, and automation. The following schema is designed for CTOs running multi-horizon portfolios.
3.2 Risk ID Convention
A consistent naming convention enables automation and reporting. Use the pattern H[1-3]-[CAT]-[###], where CAT is a three-letter category code (TEC, MKT, FIN, OPS, REG, PPL, STR). For example, H3-REG-001 identifies the first regulatory risk in the Horizon 3 portfolio. This convention makes heat maps, dashboards, and Jira backlogs instantly scannable.
3.3 Data Model: SQL Schema
The following PostgreSQL schema provides a foundation for a risk register integrated with your product portfolio. It supports risk hierarchies, control tracking, and audit trails.
CREATE TABLE risk_register (
    risk_id VARCHAR(16) PRIMARY KEY,
    horizon SMALLINT NOT NULL CHECK (horizon IN (1,2,3)),
    category VARCHAR(32) NOT NULL,
    title VARCHAR(255) NOT NULL,
    statement TEXT NOT NULL,
    owner_email VARCHAR(255) NOT NULL,
    likelihood SMALLINT NOT NULL CHECK (likelihood BETWEEN 1 AND 5),
    impact SMALLINT NOT NULL CHECK (impact BETWEEN 1 AND 5),
    velocity VARCHAR(8) NOT NULL CHECK (velocity IN ('Slow','Medium','Fast')),
    detection_difficulty SMALLINT NOT NULL CHECK (detection_difficulty BETWEEN 1 AND 5),
    inherent_score SMALLINT GENERATED ALWAYS AS (
        likelihood * impact * CASE velocity
            WHEN 'Fast' THEN 3
            WHEN 'Medium' THEN 2
            WHEN 'Slow' THEN 1
        END
    ) STORED,
    residual_score SMALLINT,
    risk_appetite VARCHAR(16) NOT NULL CHECK (risk_appetite IN ('Avoid','Reduce','Transfer','Accept')),
    status VARCHAR(16) NOT NULL DEFAULT 'Active',
    created_at TIMESTAMP DEFAULT CURRENT_TIMESTAMP,
    updated_at TIMESTAMP DEFAULT CURRENT_TIMESTAMP
);

CREATE TABLE risk_controls (
    control_id SERIAL PRIMARY KEY,
    risk_id VARCHAR(16) REFERENCES risk_register(risk_id) ON DELETE CASCADE,
    control_type VARCHAR(16) CHECK (control_type IN ('Preventive','Detective','Corrective','Directive')),
    description TEXT NOT NULL,
    owner_email VARCHAR(255) NOT NULL,
    effectiveness SMALLINT CHECK (effectiveness BETWEEN 1 AND 5),
    implementation_status VARCHAR(16) DEFAULT 'Planned',
    target_date DATE
);

CREATE TABLE risk_events (
    event_id SERIAL PRIMARY KEY,
    risk_id VARCHAR(16) REFERENCES risk_register(risk_id),
    occurred_at TIMESTAMP DEFAULT CURRENT_TIMESTAMP,
    description TEXT NOT NULL,
    financial_impact DECIMAL(15,2),
    action_taken TEXT
);
3.4 JSON Schema for API Integration
For modern engineering stacks, expose the risk register through a JSON schema validated API. This enables integration with product analytics, incident management, and roadmap tools.
{
  "$schema": "http://json-schema.org/draft-07/schema#",
  "title": "InnovationRisk",
  "type": "object",
  "required": ["risk_id","horizon","category","statement","owner","likelihood","impact","velocity"],
  "properties": {
    "risk_id": { "type": "string", "pattern": "^H[1-3]-[A-Z]{3}-[0-9]{3}$" },
    "horizon": { "type": "integer", "enum": [1, 2, 3] },
    "category": { "type": "string", "enum": ["TEC","MKT","FIN","OPS","REG","PPL","STR"] },
    "statement": { "type": "string", "minLength": 40 },
    "owner": { "type": "string", "format": "email" },
    "likelihood": { "type": "integer", "minimum": 1, "maximum": 5 },
    "impact": { "type": "integer", "minimum": 1, "maximum": 5 },
    "velocity": { "type": "string", "enum": ["Slow","Medium","Fast"] },
    "controls": {
      "type": "array",
      "items": {
        "type": "object",
        "required": ["type","description","owner"],
        "properties": {
          "type": { "enum": ["Preventive","Detective","Corrective","Directive"] },
          "description": { "type": "string" },
          "owner": { "type": "string" }
        }
      }
    }
  }
}
4. Risk Scoring and Quantification
4.1 Semi-Quantitative Scoring
The 5×5 likelihood-impact matrix remains the workhorse of risk assessment, but it must be augmented for innovation contexts. Velocity—the speed at which a risk can materialize—is critical because Horizon 3 risks can move from theoretical to existential in months. Detection difficulty matters because slow-burning risks often evade quarterly reviews.
Use the formula:
Inherent Score = Likelihood × Impact × Velocity Factor
Where velocity factors are Slow=1, Medium=2, Fast=3. A risk with likelihood 4, impact 5, and fast velocity scores 60, placing it in the critical zone regardless of detection difficulty. Detection difficulty is then used to weight monitoring investment: high detection difficulty plus high inherent score equals a sensing priority.
4.2 Expected Monetary Value
For risks with quantifiable financial outcomes, expected monetary value (EMV) improves decision-making. EMV equals probability of occurrence multiplied by estimated impact. If a Horizon 2 platform migration delay has a 30% probability of causing a €2M revenue shortfall, the EMV is €600k. Compare EMV against mitigation cost: if a €150k control reduces probability to 5%, the residual EMV falls to €100k, yielding a €350k net risk reduction.
4.3 Python Risk Scoring Utility
Embed a lightweight scoring utility in your data pipeline to recalculate risk exposure as new data arrives. The following script accepts a CSV export from the risk register and produces a prioritized heat map.
import pandas as pd
import matplotlib.pyplot as plt

VELOCITY_FACTOR = {'Slow': 1, 'Medium': 2, 'Fast': 3}

def score_risk(row):
    return row['likelihood'] * row['impact'] * VELOCITY_FACTOR.get(row['velocity'], 1)

def categorize(score):
    if score >= 48: return 'Critical'
    if score >= 24: return 'High'
    if score >= 12: return 'Medium'
    return 'Low'

df = pd.read_csv('risk_register.csv')
df['inherent_score'] = df.apply(score_risk, axis=1)
df['category_label'] = df['inherent_score'].apply(categorize)

critical = df[df['category_label'] == 'Critical'].sort_values('inherent_score', ascending=False)
print(critical[['risk_id','title','inherent_score','owner']])

# Save heat map data for BI tools
df.to_csv('risk_register_scored.csv', index=False)
4.4 Aggregated Risk Exposure
CTOs need portfolio-level visibility. Sum residual risk scores by horizon and category to identify concentration. If Horizon 3 technical risks account for 60% of total residual exposure, the innovation portfolio is under-engineered. If Horizon 1 operational risks dominate, the core is fragile. Use these aggregates to rebalance investment and board communication.
5. Horizon-Specific Risk Profiles
5.1 Horizon 1: Core Optimization Risks
Horizon 1 initiatives aim to extend and defend the existing business. The dominant risks are execution, reliability, and incremental obsolescence. For a CTO, the risk register should prioritize the following categories:
Technical Debt and Architecture Erosion (H1-TEC-001): Continuous optimization without refactoring accumulates technical debt, increasing the cost and risk of future Horizon 2 and Horizon 3 initiatives. The control is a dedicated refactoring budget—typically 15-20% of engineering capacity—governed by architecture decision records (ADRs) and quarterly fitness-function reviews.
Platform and Vendor Concentration (H1-TEC-002): Over-dependence on a single cloud provider, database, or framework creates lock-in and negotiating weakness. Mitigation includes multi-cloud abstraction layers, API gateways, and active supplier diversification for critical components.
Cybersecurity and Operational Resilience (H1-OPS-001): The core generates revenue; its outage or breach is existential. Controls include zero-trust architecture, immutable backups, chaos engineering, and incident response playbooks aligned with ISO 22301 business continuity principles.
Margin Compression from Automation (H1-FIN-001): While automation reduces unit costs, it can commoditize the core offering if competitors achieve equivalent efficiency. Mitigation requires coupling operational excellence with continuous differentiation through customer experience or proprietary data.
5.2 Horizon 2: Adjacent Growth Risks
Horizon 2 moves existing capabilities into adjacent markets or segments. These initiatives carry market and integration risks that differ materially from Horizon 1.
Market Segment Mismatch (H2-MKT-001): The adjacent market may value different attributes than the core. Mitigation requires disciplined discovery: minimum viable experiments (MVEs), paid landing-page tests, and early-adopter interviews before significant engineering investment.
Partnership and Channel Failure (H2-STR-001): Horizon 2 often relies on partners for distribution, compliance, or technology. Partner dependency introduces counterparty risk. Controls include partner scorecards, contractual SLA remedies, and parallel channel development.
Integration Complexity (H2-TEC-001): Adjacent offerings must integrate with core systems without destabilizing them. Microservices, event-driven architecture, and bounded contexts reduce coupling. A strangler fig pattern can migrate capability incrementally.
Cannibalization Anxiety (H2-FIN-002): Fear of cannibalizing the core can starve Horizon 2. The board must explicitly authorize controlled cannibalization when the alternative is competitor-driven disruption. Financial modeling should compare internal cannibalization with external erosion.
5.3 Horizon 3: Disruptive Invention Risks
Horizon 3 is the domain of optionality. Risks here are not defects to eliminate but uncertainties to navigate. The CTO’s role is to create a portfolio of small, informed bets with clear kill criteria.
Technology Invalidation (H3-TEC-001): The chosen technology may be superseded before commercialization. Mitigation is staged investment tied to technical milestones, not calendar dates. Maintain exposure to multiple technology paths through partnerships and research collaborations.
Regulatory and Ethical Rejection (H3-REG-001): Emerging technologies—AI, biotech, autonomous systems—face evolving regulatory landscapes. Engage early with regulators, invest in ethics review boards, and design for compliance by default rather than retrofit.
Capital Runway Exhaustion (H3-FIN-001): Horizon 3 consumes cash long before revenue. Define tranches of funding gated by learning milestones. Use real options valuation to decide whether to continue, pivot, or abandon.
Organizational Antibodies (H3-PPL-001): The core organization often resists Horizon 3 because it threatens processes, status, and metrics. Structural separation—labs, incubators, venture studios—combined with explicit CEO sponsorship, protects exploratory teams.
6. Mitigation Strategy Design
6.1 The ARTA Framework
Risk treatment follows four classical strategies, adapted for innovation portfolios:
- Avoid: Eliminate the risk by not pursuing the activity. Appropriate when residual risk exceeds appetite and no cost-effective control exists.
- Reduce: Implement controls that lower likelihood, impact, or velocity. This is the default for Horizon 1 and most Horizon 2 risks.
- Transfer: Shift financial consequence through insurance, partnerships, or contractual indemnification. Common for compliance and supply-chain risks.
- Accept: Consciously retain risk when treatment cost exceeds benefit or when risk is inherent to strategic optionality. Mandatory for Horizon 3 speculative bets.
6.2 Control Taxonomy
Controls fall into four categories. Effective mitigation layers them:
- Preventive: Stop the risk from occurring. Examples include code review gates, architecture standards, and partner due diligence.
- Detective: Identify risk materialization early. Examples include anomaly detection, dashboards, audits, and health checks.
- Corrective: Reduce impact after occurrence. Examples include rollback procedures, incident playbooks, and business continuity plans.
- Directive: Shape behavior to reduce risk. Examples include training, policies, and target operating models.
6.3 Residual Risk Targets
Define residual risk appetite by horizon. A useful starting point:
- Horizon 1: Residual scores should generally be Low (≤11). Core operations must be robust.
- Horizon 2: Accept Medium residual risk (12-23) where market upside justifies it.
- Horizon 3: High residual risk (24-47) is acceptable if the bet is small, reversible, and aligned with strategic optionality. Critical risks (≥48) require explicit board approval.
6.4 Mitigation Backlog and RACI
Convert mitigation plans into a backlog with owners, target dates, and acceptance criteria. Use a RACI matrix to clarify decision rights: Risk Owner is Accountable, control implementers are Responsible, legal/compliance are Consulted, and the board is Informed for critical risks.
7. Implementation Playbook: 90 Days from Zero to Operating Rhythm
Days 1-14: Discovery and Foundation
Assemble a cross-functional risk working group spanning engineering, product, finance, legal, and business units. Inventory all active innovation initiatives and assign them to horizons. Conduct interviews and document existing risk practices. Select a register tool: for most CTOs, a combination of a structured spreadsheet or database, Jira for mitigation tracking, and a BI dashboard is sufficient. Do not over-engineer tooling before process maturity.
Days 15-30: Register and Scoring
Populate the initial register with a minimum of 20 risks across all three horizons. Use facilitated workshops with structured prompts: "What could make our Q4 release miss?" "What could invalidate our Horizon 3 bet?" "What dependencies are outside our control?" Score likelihood, impact, velocity, and detection difficulty. Produce a first heat map and identify the top 10 risks requiring immediate treatment.
Days 31-60: Mitigation Design and Runbooks
For each top risk, define ARTA treatment, layered controls, owners, and deadlines. Write runbooks for high-velocity risks: incident response, communication trees, escalation criteria, and rollback procedures. Integrate controls into existing workflows rather than creating parallel processes.
Days 61-90: Governance and Automation
Establish a monthly risk review cadence for Horizon 1, bi-weekly for Horizon 2, and per-milestone for Horizon 3. Automate risk scoring refresh from incident data, project status, and external threat feeds. Publish a quarterly risk report to the executive committee and board.
8. Case Studies in Strategic Innovation Risk
8.1 Nokia: Horizon 3 Governance Collapse
Nokia’s smartphone failure is frequently attributed to missed technological shifts, but the deeper cause was risk governance. The company treated Symbian as a Horizon 1 cash cow long after the market had shifted. Internal prototypes of touch-driven operating systems existed, but they were evaluated with core-business metrics and killed because they threatened existing revenue. The lesson: Horizon 3 initiatives must have separate governance, metrics, and protection from core-business antibodies.
8.2 Kodak: Controlled Cannibalization Avoided
Kodak invented the digital camera in 1975 but chose to protect film profits. The risk register of the era, had it existed, would have categorized digital imaging as a cannibalization threat rather than a market-transition necessity. Kodak’s failure was not technological blindness but risk appetite misalignment. A modern CTO would model digital transition as an unavoidable market shift and manage cannibalization explicitly.
8.3 Amazon Web Services: Horizon 2 Separation
AWS began as an internal platform. Amazon recognized that cloud infrastructure was a distinct Horizon 2 opportunity requiring different metrics, talent, and customer focus. By separating AWS operationally and giving it long-term investment runway, Amazon transformed internal capability into a market-defining business. The risk management implication: adjacent opportunities require protected resource allocation and distinct KPIs.
8.4 Microsoft: Cloud Transformation Risk Rebalancing
Microsoft’s shift to cloud under Satya Nadella involved rebalancing the entire risk portfolio. The company accepted near-term revenue decline in on-premises software to build Azure and Office 365. The CTO organization implemented cloud-native engineering practices, security-first architecture, and a growth mindset culture. The risk register evolved from license-compliance and release-management focus to platform resilience and customer success metrics.
9. Common Pitfalls and How to Avoid Them
- Risk Theater: Maintaining a register that nobody reads or updates. Solution: tie risk status to executive decision forums and roadmap prioritization.
- Horizon Blending: Applying the same metrics to all horizons. Solution: publish separate dashboards with horizon-specific KPIs.
- Owner Ambiguity: Naming a team rather than an individual. Solution: every risk has one accountable owner with name, email, and escalation path.
- Lagging Indicators Only: Tracking incidents after they occur. Solution: define leading indicators such as test coverage, dependency health, and market signal strength.
- Neglecting Residual Risk: Treating mitigation planning as risk elimination. Solution: always report residual score and appetite alignment.
- Ignoring Human Factors: Focusing exclusively on technical controls. Solution: include training, incentives, and culture in the control set.
10. Future Directions: Continuous Risk Intelligence
The next evolution of innovation risk management is continuous, data-driven, and AI-assisted. CTOs should build risk intelligence platforms that ingest telemetry from CI/CD pipelines, product analytics, security scanners, financial systems, and external feeds. Machine learning can detect anomaly patterns that precede incidents, enabling proactive rather than reactive treatment.
Scenario planning should be automated with digital twins and Monte Carlo simulation, allowing leaders to test portfolio decisions under thousands of synthetic futures. Natural language processing can monitor regulatory, competitive, and social signals for emerging risks. The goal is not to predict the future, but to reduce surprise and increase adaptive capacity.
Ultimately, strategic innovation risk management is a core leadership discipline. The CTO who masters it does not avoid uncertainty; they architect organizations that thrive within it.
4.5 Monte Carlo Simulation for Strategic Innovation Portfolios
Point estimates of risk are useful for communication but dangerous for decision-making under deep uncertainty. Monte Carlo simulation converts distributions of input variables into a distribution of outcomes, revealing the probability of achieving a target rather than a single expected value. For a CTO managing a multi-horizon innovation portfolio, this is essential because Horizon 2 and Horizon 3 outcomes are rarely symmetric.
Build a simple model with three input distributions: time-to-market (triangular orPERT), adoption rate (beta), and unit economics (normal). Run 10,000 iterations to produce a probability distribution of net present value (NPV), internal rate of return (IRR), or payback period. The output is not a forecast; it is a map of uncertainty. If the fifth percentile NPV is deeply negative while the median is attractive, the initiative is fragile and requires optionality.
The following Python snippet illustrates a lightweight Monte Carlo for a Horizon 2 adjacent product launch. It estimates the probability of breaking even within 24 months.
import numpy as np

def simulate_launch(n=10000):
    # Distributions estimated by product and finance
    dev_months = np.random.triangular(8, 12, 20, n)
    monthly_customers = np.random.normal(500, 150, n).clip(50)
    arpu = np.random.normal(120, 25, n)
    cac = np.random.normal(60, 15, n)
    fixed_cost = np.random.normal(400000, 50000, n)
    # 24-month contribution margin minus fixed cost
    profit = 24 * monthly_customers * (arpu - cac) - fixed_cost
    return profit

profits = simulate_launch()
breakeven_prob = np.mean(profits > 0)
print(f"Probability of breakeven: {breakeven_prob:.1%}")
print(f"5th percentile NPV: ${np.percentile(profits, 5):,.0f}")
print(f"95th percentile NPV: ${np.percentile(profits, 95):,.0f}")
4.6 Failure Mode and Effects Analysis (FMEA) for Technology Transitions
FMEA is a systematic method for identifying how a process, product, or system might fail, the effect of failure, and the controls in place. It produces a Risk Priority Number (RPN) by multiplying severity, occurrence, and detection on a 1-10 scale. FMEA is particularly powerful for Horizon 1 operational changes and Horizon 2 integration programs where failure modes are concrete.
For example, consider the migration of a monolithic order-management system to microservices in support of a Horizon 2 marketplace. Failure modes include data inconsistency during cutover, latency spikes in the payment path, and degraded search indexing. Each mode is rated for severity to the customer, likelihood of occurrence, and difficulty of detection. Modes with the highest RPN receive priority mitigation: dual-write reconciliation, synthetic transaction monitoring, and automated rollback.
5.4 Sample Horizon-Aware Risk Register
The following sample register illustrates how risks are classified and scored in practice. It is intentionally simplified; production registers contain dozens of entries and are linked to controls, incidents, and roadmap items.
6.5 Insurance and Contractual Transfer
Not all technology risks can be reduced internally. Transfer strategies use insurance, contracts, and market instruments to cap financial exposure. Cyber liability insurance covers breach response, regulatory fines, and business interruption. Technology errors and omissions insurance protects against claims arising from system failures that harm customers. For mission-critical vendors, negotiate contractual indemnification, data escrow, and step-in rights.
Open-source license risk is often overlooked. A single dependency with a viral copyleft license can contaminate a proprietary codebase. Mitigation includes software composition analysis (SCA) tools, license policies in CI/CD, and legal review of dependencies in Horizon 2 and Horizon 3 products.
7.5 Risk Dashboards and KPIs
Effective risk governance requires dashboards that translate register data into actionable intelligence. Leading indicators predict risk materialization; lagging indicators confirm outcomes. The following KPIs are designed for a CTO dashboard.
7.6 Integrating Risk Management with Agile and OKRs
Risk management fails when it lives outside the operational rhythm. Agile teams already conduct retrospectives and backlog refinement; risk should be a first-class item in both. During sprint planning, teams should ask: what is the riskiest assumption we are making this sprint, and what is the smallest experiment that validates or invalidates it?
Objectives and Key Results (OKRs) can be risk-weighted. A key result to launch a new API carries different risk than a key result to improve page-load time. When OKRs are scored, include a risk-adjusted confidence level. If confidence is low, define a risk-mitigation key result alongside the outcome key result.
Quarterly business reviews should include a risk register review. Risks that threaten key results are escalated; risks that are no longer relevant are closed. This integration ensures that risk management is not an annual compliance ritual but a continuous strategic discipline.
8.5 Netflix: Resilience Engineering as Risk Reduction
Netflix's migration from on-premises data centers to Amazon Web Services is a canonical example of Horizon 1 operational risk transformation. Rather than simply rehosting, Netflix redesigned for failure. The Chaos Monkey randomly terminates production instances, forcing engineers to build systems that tolerate component failure. The Simian Army expanded this practice to latency injection, security violations, and regional failover.
The risk management lesson is that resilience is not achieved by avoiding failure but by practicing it. For Horizon 1 systems, controlled failure injection reduces the likelihood and impact of unplanned outages. The CTO should budget for chaos engineering, game days, and regional disaster recovery exercises as essential controls.
8.6 Spotify: Distributed Risk Ownership
Spotify's squad and tribe model distributes ownership while maintaining alignment. Each squad owns a mission and is accountable for outcomes, including risk. This prevents risk from becoming the sole responsibility of a centralized risk function that lacks engineering context. Instead, risk owners sit close to the code, the customers, and the data.
The model requires guardrails: architecture standards, platform capabilities, and clear escalation paths. Without them, distributed ownership can fragment risk accountability. The CTO must balance autonomy with coherence, giving squads freedom to manage their risks while ensuring enterprise-wide risk appetite is respected.
11. Risk Governance Operating Model
A mature risk governance model uses the "three lines" framework. The first line owns risk in the business and engineering teams. They identify, assess, and treat risks as part of daily work. The second line provides oversight, sets risk appetite, maintains the register, and reports to leadership. The third line is internal audit, providing independent assurance that controls are effective.
For technology organizations, the first line includes product managers, engineering managers, and security engineers. The second line may be a Chief Information Security Officer, Chief Risk Officer, or an enterprise risk function. The third line is internal audit. A CTO sits across all three lines, ensuring that technology strategy and risk appetite are aligned.
Escalation thresholds should be explicit. A Horizon 1 risk with a residual score above 23 might escalate to the VP of Engineering. A Horizon 3 risk requiring more than €500k in additional funding might escalate to the CEO and board. Clear thresholds reduce politics and accelerate decisions.
12. Technology Stack for Risk Intelligence
The tooling stack should match process maturity. Early-stage programs can use spreadsheets, Jira, and dashboards. Mature programs benefit from integrated risk management platforms such as ServiceNow GRC, MetricStream, RSA Archer, or newer entrants like 6clicks and Hyperproof. These platforms provide workflow, reporting, and audit trails.
Data sources for risk intelligence include CI/CD pipelines (deployment frequency, failure rates), observability platforms (latency, error rates, traces), security scanners (vulnerabilities, license issues), financial systems (budget variance, revenue attribution), and external feeds (regulatory changes, competitive moves, threat intelligence). The CTO should treat risk data as a first-class data product with defined owners, quality standards, and refresh cadences.
13. Risk Culture and Incentives
Process and tooling matter, but culture determines whether risk management survives contact with organizational reality. In many technology companies, incentives reward shipping features and hitting revenue targets while punishing delays caused by risk mitigation. This asymmetry produces hidden risk: teams understate uncertainty, skip controls, and avoid bad news.
CTOs must redesign incentives to reward risk-aware behavior. Engineering managers should be evaluated on operational health, not just velocity. Product managers should be rewarded for validating assumptions before scaling, even when validation means killing a feature. Incident post-mortems should focus on learning, not blame. When a team identifies a critical risk early and mitigates it, that success should be celebrated as loudly as a product launch.
Psychological safety is the foundation. If engineers fear retaliation for raising risks, the register becomes a fiction. Leaders must model vulnerability by discussing their own uncertainties and decisions they would make differently with hindsight. Regular "pre-mortems" help teams imagine a future failure and work backward to identify current risks without the stigma of having failed.
14. Risk-Adjusted Capital Allocation
Capital allocation is the ultimate expression of risk appetite. A CTO cannot claim to support Horizon 3 experimentation if 95% of the engineering budget is locked into Horizon 1 optimization. A common rule of thumb is the 70-20-10 heuristic: 70% of resources to the core, 20% to adjacent growth, and 10% to disruptive exploration. The exact split should reflect industry maturity, competitive pressure, and balance-sheet strength.
Risk-adjusted capital allocation goes further by discounting expected returns for uncertainty. A Horizon 2 initiative with a lower expected NPV but lower variance may be preferable to a high-NPV initiative with binary outcomes. Real options thinking is essential: fund Horizon 3 projects in stages, with each tranche contingent on resolving a key uncertainty. This preserves capital and reduces regret.
The board should see not only proposed budgets but also the risk-adjusted distribution of outcomes. A portfolio view reveals whether the company is over-invested in low-growth defense or over-exposed to unproven bets. The CTO plays a central role in translating technical risk into capital language.
15. Scenario Planning and War Gaming
Scenario planning expands risk thinking beyond the register by constructing coherent narratives about possible futures. A technology team might develop scenarios such as "AI commoditizes our core analytics," "regulators ban our data practice," or "a competitor open-sources a superior platform." Each scenario is assigned probability and implications, then used to stress-test strategy.
War gaming adds adversarial dynamics. In a war game, one team represents the company and another represents competitors, regulators, or attackers. The exercise reveals blind spots, tests contingency plans, and builds shared mental models. For Horizon 3, war gaming is particularly valuable because the competitive landscape is undefined and traditional forecasting fails.
Scenarios should not be one-off exercises. They should be refreshed quarterly and integrated into strategic planning. The risk register should reference the scenarios that each risk is most sensitive to, making the connection between abstract risk and concrete future explicit.
16. Board Reporting and Communication
The board does not need a list of every technical risk; it needs a concise view of how technology risk affects strategic objectives. A good board report contains four elements: a summary of the risk landscape, changes since the last report, the top risks requiring attention, and the mitigation actions underway. Visuals such as heat maps, trend charts, and portfolio exposure summaries communicate faster than tables.
Risk appetite should be stated in business terms. Instead of "residual score below 23," say "we accept no more than a 5% probability of a customer-facing outage exceeding four hours." This translation builds trust and enables informed trade-offs. The CTO should also report on risk culture metrics: incident reporting rates, time to escalate, and closure of mitigation actions.
Transparent communication about uncertainty does not weaken leadership; it strengthens it. Boards and investors understand that innovation requires risk. What they cannot tolerate is unmanaged surprise. A disciplined risk reporting rhythm turns uncertainty from a liability into a source of competitive confidence.
17. Risk Management Maturity Model
Maturity models help organizations assess where they are and what capabilities to build next. A five-level maturity model for strategic innovation risk management might look as follows:
- Level 1 – Ad hoc: Risk management is reactive. Risks are discussed informally and addressed when they become crises. No register exists.
- Level 2 – Defined: A basic risk register is maintained for major projects. Roles and processes are documented but inconsistently followed.
- Level 3 – Managed: Risk management is integrated into planning cycles. Registers are updated regularly, scored consistently, and reviewed in leadership forums.
- Level 4 – Quantified: Risks are expressed in probabilistic and financial terms. Monte Carlo, real options, and stress testing inform capital allocation.
- Level 5 – Optimized: Risk intelligence is automated and embedded in decision systems. The organization adapts risk posture dynamically based on real-time signals.
Most technology organizations operate between Level 2 and Level 3. The goal is not to reach Level 5 overnight but to advance deliberately, investing in capabilities that produce the highest marginal improvement. A CTO should conduct an honest maturity assessment and publish a roadmap for advancement.
18. Putting It All Together: The CTO Action List
Translating this framework into practice begins with a small set of high-leverage actions. First, establish the risk register with the schema and ID convention described here. Second, populate it through structured workshops covering all three horizons. Third, score risks consistently and define risk appetite by horizon. Fourth, assign owners and mitigation backlogs. Fifth, integrate risk review into existing governance rhythms. Sixth, build dashboards that make risk visible. Seventh, communicate transparently with the board.
Over time, the register becomes more than a defensive tool; it becomes a strategic compass. It shows where the organization is fragile, where it is over-invested, and where optionality is underpriced. The CTO who masters risk management does not eliminate uncertainty but transforms it into a disciplined source of competitive advantage.
References
- Baghai, M., Coley, S., & White, D. (2000). The Alchemy of Growth: Practical Insights for Building the Enduring Enterprise. Basic Books.
- ISO 31000:2018. (2018). Risk Management — Guidelines. International Organization for Standardization.
- COSO. (2017). Enterprise Risk Management — Integrating with Strategy and Performance. Committee of Sponsoring Organizations of the Treadway Commission.
- PMI. (2021). The Standard for Risk Management in Portfolios, Programs, and Projects. Project Management Institute.
- NIST. (2012). SP 800-30 Rev. 1, Guide for Conducting Risk Assessments. National Institute of Standards and Technology.
- ISO/IEC 27005:2022. (2022). Information Security Risk Management. International Organization for Standardization.
- Kaplan, R. S., & Mikes, A. (2012). Managing Risks: A New Framework. Harvard Business Review, 90(6), 48-60.
- Taleb, N. N. (2012). Antifragile: Things That Gain from Disorder. Random House.
- Christensen, C. M. (1997). The Innovator's Dilemma: When New Technologies Cause Great Firms to Fail. Harvard Business School Press.
- Leonard-Barton, D. (1992). Core Capabilities and Core Rigidities: A Paradox in Managing New Product Development. Strategic Management Journal, 13(S1), 111-125.
- O'Reilly, C. A., & Tushman, M. L. (2013). Organizational Ambidexterity: Past, Present, and Future. Academy of Management Perspectives, 27(4), 324-338.
- March, J. G. (1991). Exploration and Exploitation in Organizational Learning. Organization Science, 2(1), 71-87.
- McKinsey & Company. (2023). The State of Organizations 2023.
- BCG. (2023). The Most Innovative Companies 2023. Boston Consulting Group.
- Deloitte. (2024). Global Risk Management Survey, 13th Edition.
- KPMG. (2023). Global Tech Report 2023.
- EY. (2024). How Can Risk Management Keep Pace with AI? Ernst & Young.
- PwC. (2024). Global Risk Study 2024. PricewaterhouseCoopers.
- Rumsfeld, D. (2002). Known Knowns, Known Unknowns, and Unknown Unknowns. U.S. Department of Defense News Briefing.
- ISO 22301:2019. (2019). Security and Resilience — Business Continuity Management Systems. International Organization for Standardization.
